For founders & marketers who need visuals every week.
Save draft mockups Unlimited downloadsShip more creatives without second‑guessing exports or hitting caps.10,000+ Mockup TemplatesFind a ready-to-go mockup for almost any product, device, or use case—fast.4000+ Design templatesStart from proven layouts instead of designing from scratch every time.Unlimited storageKeep every campaign, iteration, and client version in one place—no cleanup stress.Save draft mockupsIterate quickly and pick up where you left off without losing versions.Commercial licenceUse designs in client work and marketing confidently—no licensing anxiety.Social media integrationsPublish faster and keep your content pipeline moving without extra steps.Upload your own PSD mockupsUse your custom mockups while keeping the same workflow and editor speed.Money back guaranteeTry it with less risk—if it’s not right, you’re not stuck.Cancel at any timeStay flexible—scale up or pause without lock-in.Priority SupportGet unblocked faster when something breaks or you’re on a deadline.
Most popular
Professional yearly
$190/year
Same plan, lower effective monthly cost. Get 2 months free.
Save draft mockups Unlimited downloadsShip more creatives without second‑guessing exports or hitting caps.10,000+ Mockup TemplatesFind a ready-to-go mockup for almost any product, device, or use case—fast.4000+ Design templatesStart from proven layouts instead of designing from scratch every time.Unlimited storageKeep every campaign, iteration, and client version in one place—no cleanup stress.Save draft mockupsIterate quickly and pick up where you left off without losing versions.Commercial licenceUse designs in client work and marketing confidently—no licensing anxiety.Social media integrationsPublish faster and keep your content pipeline moving without extra steps.Upload your own PSD mockupsUse your custom mockups while keeping the same workflow and editor speed.Money back guaranteeTry it with less risk—if it’s not right, you’re not stuck.Cancel at any timeStay flexible—scale up or pause without lock-in.Priority SupportGet unblocked faster when something breaks or you’re on a deadline.
Money back guarantee. Applicable taxes not included. All prices in USD.
Your payment is being verified...
Please wait until payment verification is finished. This should take a few seconds.
Payment is still processing.
Your payment is processing longer than usual. It should still be completed in a few minutes.
Payment Successfully Completed. Thank You!
We created your Mediamodifier account so you can start downloading mockups and design templates right away.
Create a password for your account
Your subscription is active. You now have unlimited downloads, 10,000+ mockup templates, 4000+ design templates, unlimited storage, and Priority Support. Go to your account dashboard to manage your subscription.
Forgot your password?
Not to worry, we got you!
Let's get you a new password.
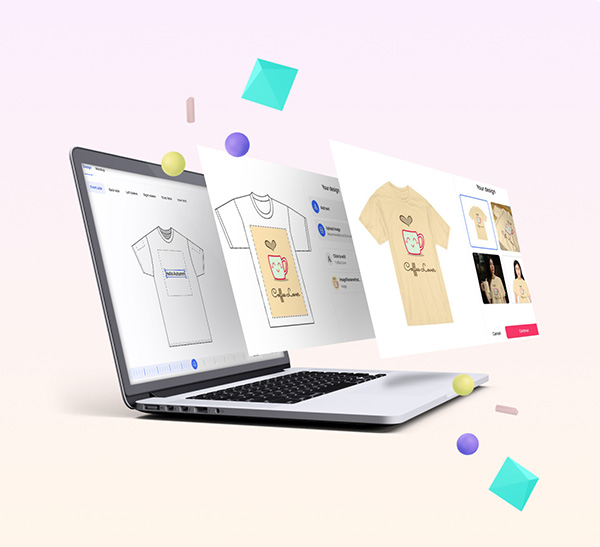
Publish your content directly to social media
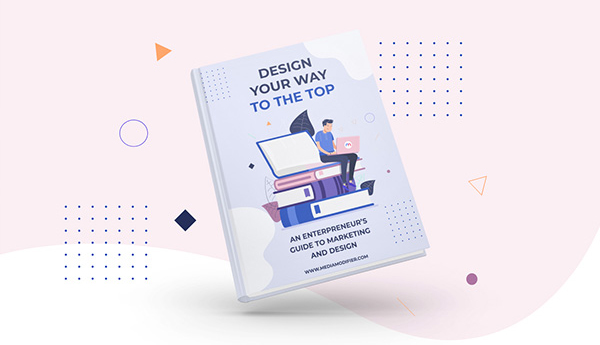
Design your way to the top: an entrepreneur’s guide to marketing and design.
This book helps you take the first steps to level up your marketing strategy and gives you the tools to create visuals that boosts sales.