How to Create an Infographic Online With Mediamodifier

If creating an online infographic has scared you off in the past, then you’ve come to the right place. Why? Because creating infographics today is easier, especially when you’ve got Mediamodifier with its easy-to-use drag and drop design editor. In this tutorial, we will explain how to create an infographic online in a few minutes.
If you’ve felt intimidated by complex graphic design software in the past, you’ll be relieved to know that Mediamodifier offers a user-friendly drag-and-drop editor that makes infographic creation quick and accessible. In just a few steps, you can transform data into compelling visuals tailored to your audience—whether for a blog post, presentation, social media, or professional report.
How to create an infographic online in 5 steps
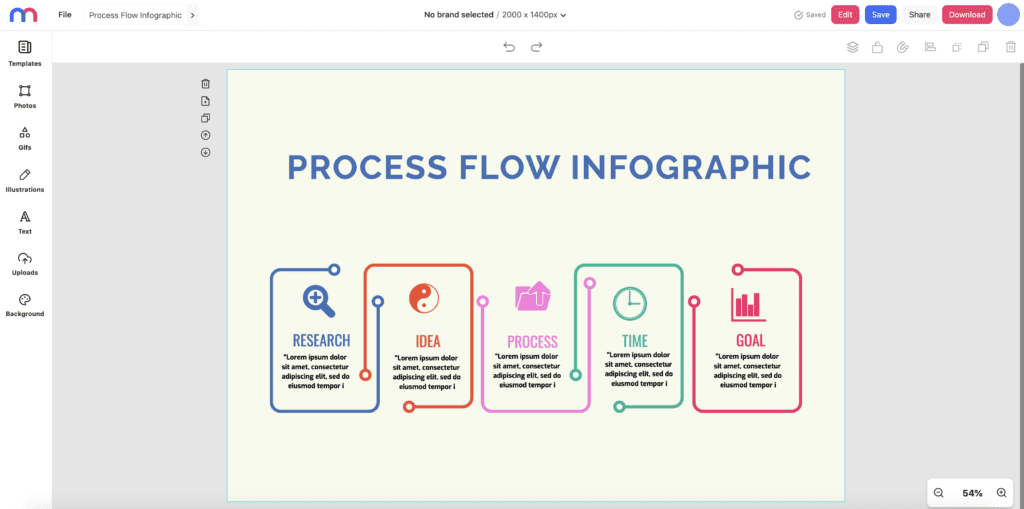
I chose Mediamodifier’s process flow infographic template for this example.
1. Define your goal(s) and audience
Infographics help you to provide a quick overview of a particular topic to an audience. Firstly, what is your infographic for, and to who are you presenting it? Here are some questions for you to consider when defining your goal(s) and audience:
Is your infographic meant to entertain or to educate?
If it’s meant to entertain, then you know you have some leeway when it comes to design as you want to be more casual and colorful with it. However, if it’s meant to be informative and educational, then you may want to consider how academic and/or corporate your infographic should be.
Where will your infographic be published and who will be seeing it?
These two questions come hand-in-hand as they relate to each other. Where will your infographic be published – will it be a part of a blog post, an annual report, a business presentation, or simply a one-time social media post?
Who will be viewing your infographic? Will you be showing it to your fellow teammates, your customers, your bosses, investors, or another audience?
What kind of infographic are you creating?
Think about the kind of infographic you are intending to create. If your infographic is meant to be a part of a blog post, what is the blog post about? Moreover, are you presenting statistical data, showcasing a process of doing something, or steps/tips for a particular topic?
If your infographic is for an annual report or business presentation, it’s most likely that you will be presenting data and findings or perhaps recommendations. If it’s a one-time social media post, are you posting one long infographic or perhaps shorter infographics that come as a series?
PS: Our content creation checklist is a good resource to help with this step!
Example time
As I’m intending to showcase the process of creating an infographic online, this would be how I define the goal and audience for my infographic:
| Topic | 5 Steps to Creating an Infographic Online |
| Is your infographic meant to entertain or to educate? | This infographic is meant to inform and educate casually. |
| Where will your infographic be published and who will be seeing it? | The infographic will be published within my blog post to illustrate the points I am highlighting. My audience is likely to be marketers, designers, and small business owners. |
| What kind of infographic are you creating? | I am creating an infographic that showcases the process of how to create an infographic. It is a one-time infographic that should be short and easy to read and digest. |
2. Gather your information
The next step is to gather the information that you will be using in your infographic. Meaningful, succinct information matters so you may want to look internally and subsequently, lookout for good sources.
Look internally
Do you have any information of your own? Whether you are a one-person team or part of a bigger company, you may already possess some information that can be useful for your infographic, for example:
- Your tips and advice that you use
- From your own Google Analytics, you can find out which times of the day, devices, and web browsers your customers use.
- Perhaps your company has an internal or external survey/report they have done recently
Find reputable sources
Google is often our best friend for research but sometimes, there may be too many sources for your topic. Depending on what your topic is, some great places/sources to look at are Statista, Kaggle, the Pew Research Center, government websites that publish statistics, Google News, and news websites.
Other good sources include secondary reports and surveys that share good statistics. Many companies often provide annual survey reports such as Hubspot’s annual State of Customer Service Report or Postman’s annual State of the API report.
In addition, make sure to save the URL of any good sources you find as you’ll need them for the credits section of your infographic (more on that in step 5).
Also, do remember that less is more so you may want to pick and choose specific information that relates to your topic so as not to overload your infographic.
Example time
To keep this infographic simple, I decided not to add any additional information as I’m sharing the tips I use when creating infographics. If you’d like to see some good examples of information gathering that made it into an infographic, check out our Fun Facts about Invoices.
3. Visualize your information
Next, with your gathered information in hand, it’s time to visualize everything. One good step to take to help visualize the design of your information is to form a hierarchy/structure so you can lay out your information in a logical manner.
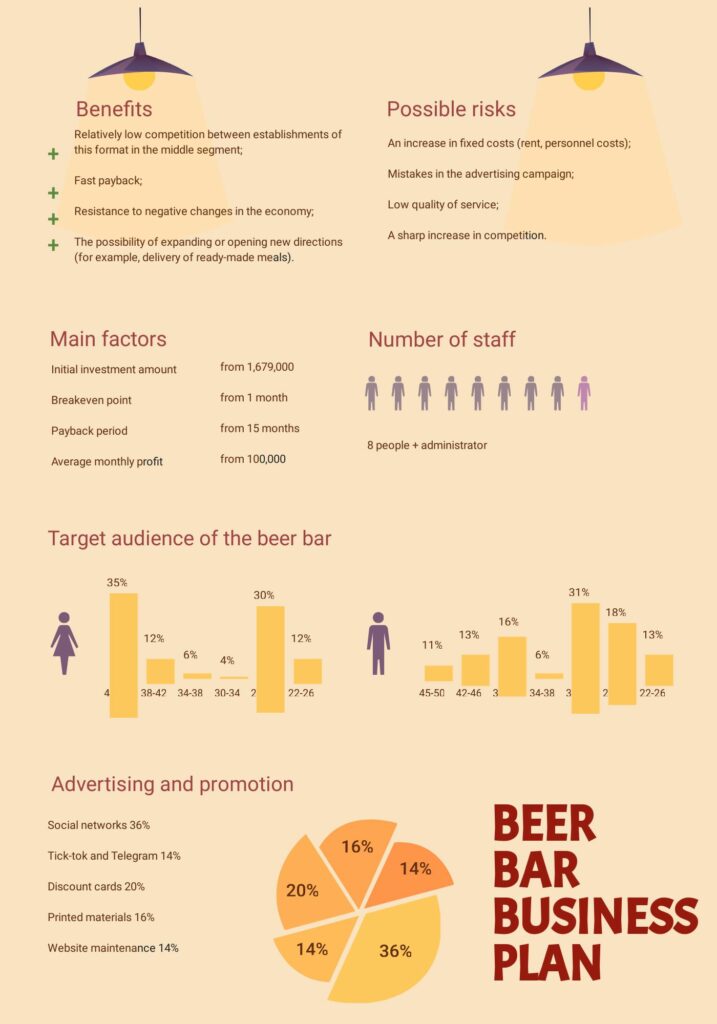
From there, be it content or data, there are different ways to visualize your information. You can present statistical data in the form of bar graphs, pie charts, line charts, data widgets, different colored icons, or even have a play with the layout of numbers and words. With content, besides a play on layout, you can present it as a step-by-step process or a list, do a comparison, or simply display an icon with information.
For example, this drag-and-drop infographic template makes use of different visualizations, such as a bar graph, a pie chart, lists, and different colored icons, to present a business plan.
Example time
For this infographic, this is the hierarchy I planned, and I intend to show these steps as a simple step process in my infographic:
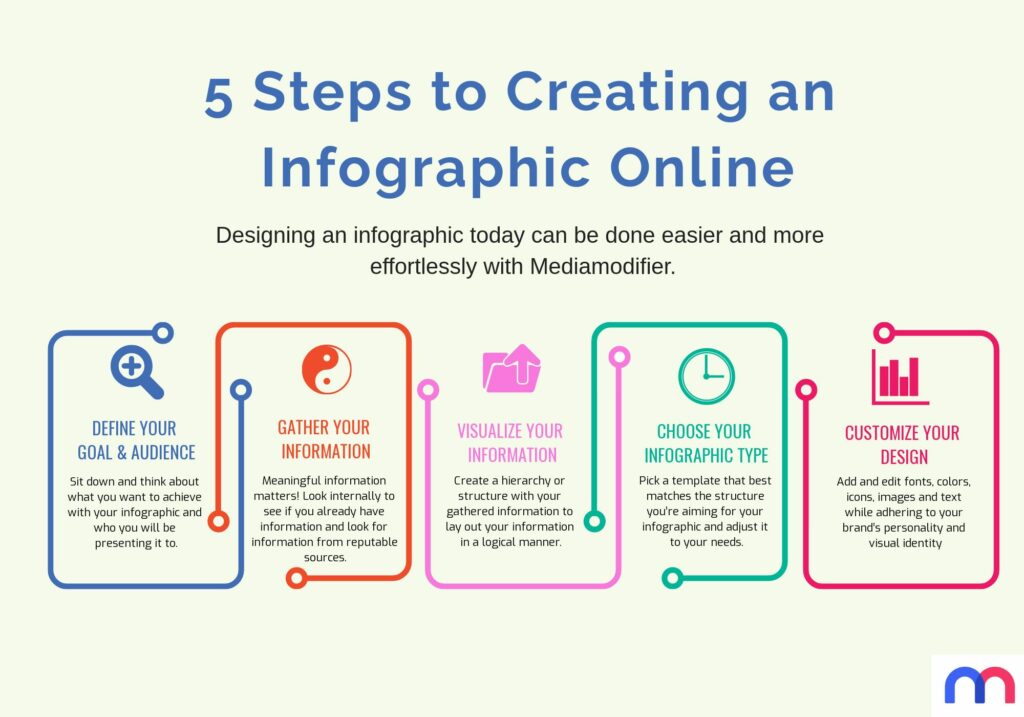
| Title: 5 Steps to Creating an Infographic Online Purpose: Designing an infographic today can be done easier and more effortlessly with Mediamodifier. Structure: 1. Define your goal and audience Sit down and think about what you want to achieve with your infographic and to who you will be presenting it. 2. Gather your information Meaningful information matters! Look internally to see if you have information and look for information from reputable sources. 3. Visualize your information Create a hierarchy or structure with your gathered information to layout your information in a logical manner. 4. Choose your infographic type Pick a template that best matches the structure you’re aiming for your infographic and adjust it to your needs. 5. Customize your design Add and edit fonts, colors, icons, images, and text while adhering to your brand’s personality and visual identity |
4. Choose your infographic template
Remember how we mentioned in step 1 that you should consider what kind of infographic you’ll be creating? Now it’s time to put that into practice.
Having visualized your information, it’s time to decide which infographic template you would like to go with. In Mediamodifier’s design editor, AKA a great Adobe alternative, we have a few different kinds of infographic templates based on what kind of infographic you want to create and the information you want to present.
Here are a few templates you can use right now:
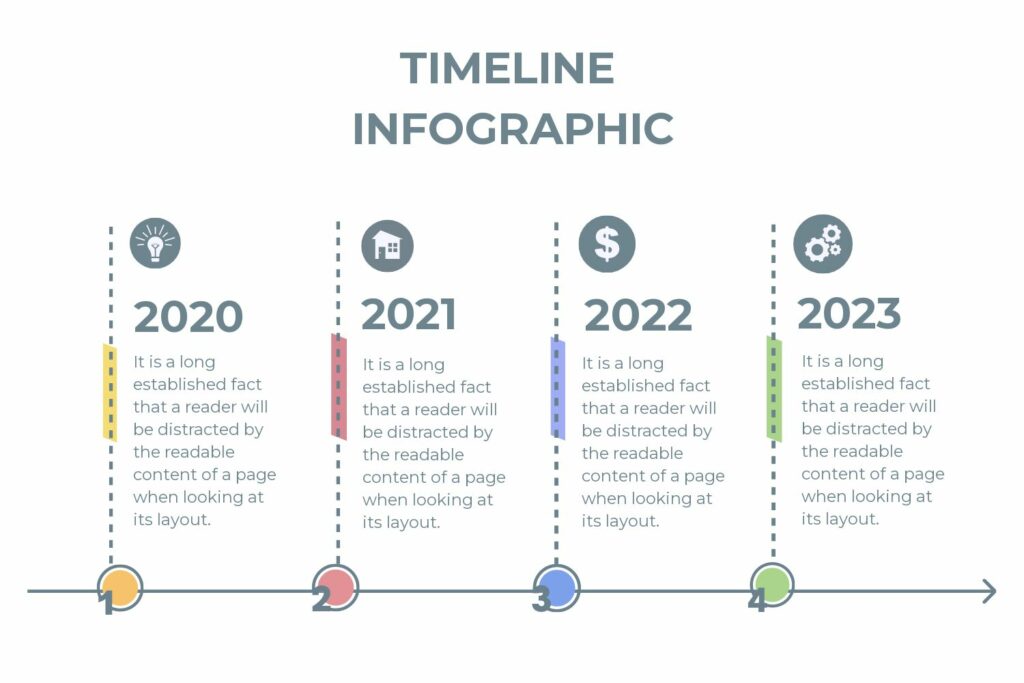
Timeline infographic
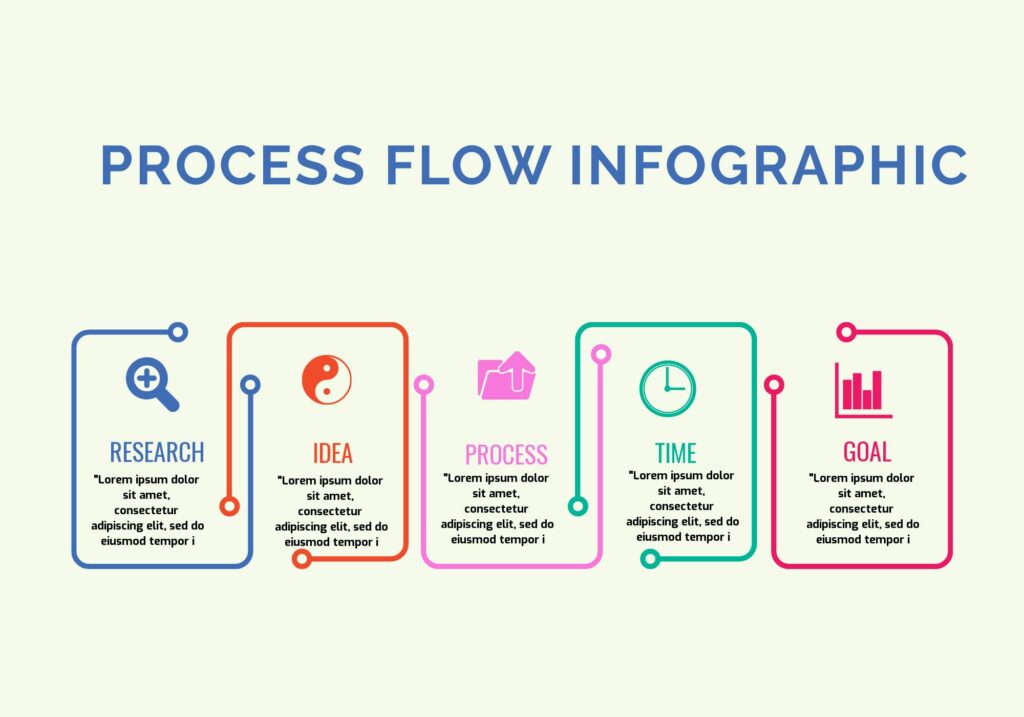
Process infographic
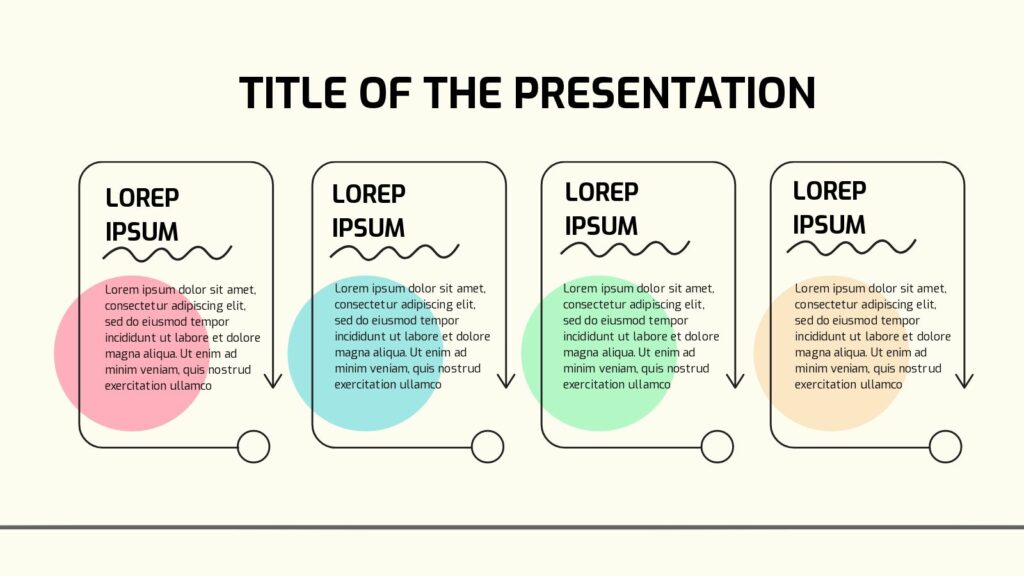
Photo infographic

Informational infographic

Comparison infographic

Pick a template that best matches the structure you’re aiming for your infographic and adjust it to your needs.
5. Customize your design
You’ve defined your goal and audience, gathered your information and visualized it, chosen your infographic template and now, it’s time to customize the design of your infographic.
As mentioned at the start of the blog post, I chose Mediamodifier’s process flow infographic template as it’s a simple, easy-to-use template that I can customize.
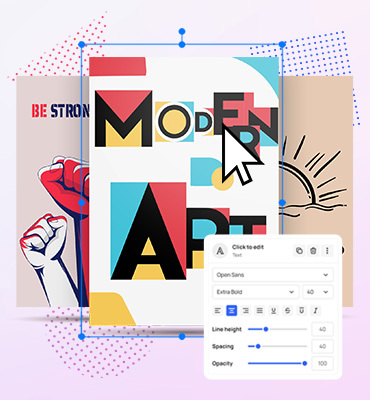
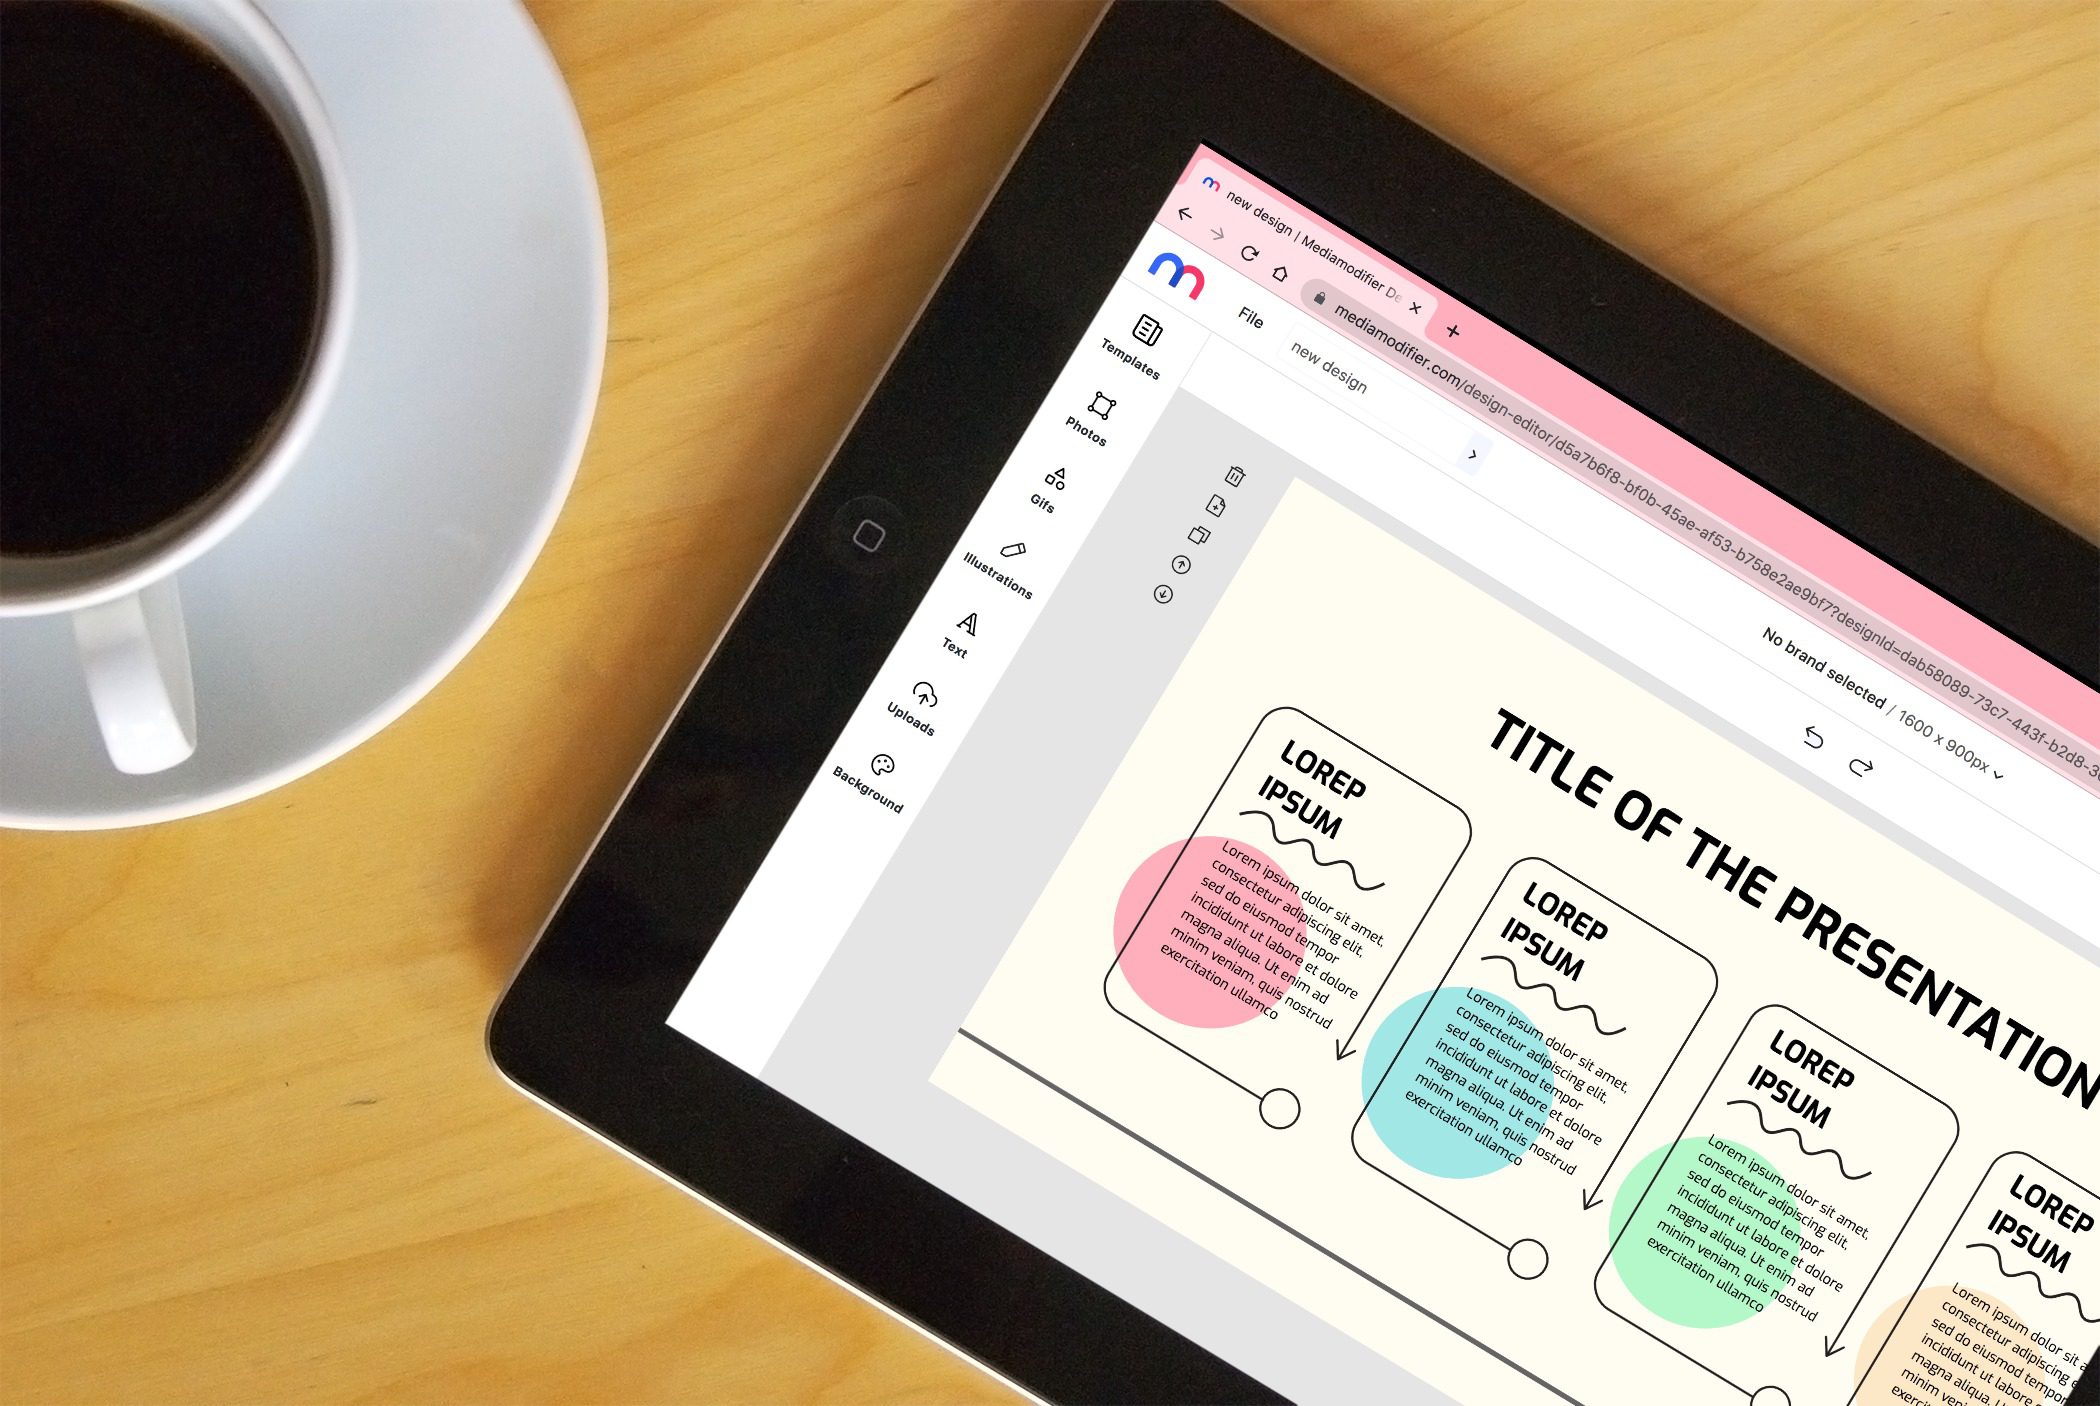
Within Mediamodifier’s design editor, you can easily add fonts, colors, icons, images, and text as well as edit them to your liking while making sure you’re adhering to your brand’s personality and visual identity.
I added my content, fixed the layout, and added the Mediamodifier logo at the bottom of my infographic.
Depending on your brand colors, you may want to go with particular color tones and fonts to ensure you bring the right message, along with the right feel, to your audience.
This is also where you want to add credits if some of the information in your infographic came from secondary sources. A great way to do this is to add a single-colored rectangular block across the bottom or at the bottom corner of your infographic and add the sources you used in small text with the title “Sources” or “Credits”, similar to how we did in our infographic about USA invoices.
That’s it, now you know how to create an infographic online!
Once you’re finished, make sure to save your awesome visual. All you have to do from here is to download your infographic from Mediamodifier, publish it straight to your social media channels or embed it onto your website.
Here’s my completed infographic.
If you have to create another infographic online, you now know how to do it. You could also go back to your saved design and use it again if you’re constantly using the same one with new, updated information. When presenting it, make sure to get rid of all the distractions, and explore how to hide desktop icons on Mac or Windows to keep focus solely on your infographics.
How to Create an Infographic Online (Summary of Steps)
- Define your goal(s) and audience
Clarify the purpose of your infographic—informative or entertaining—and identify who will view it and where it will be published. Tailor the tone and style accordingly, whether it’s casual for social media or formal for business contexts. - Gather your information
Collate relevant and concise content—from in-house data or external reputable sources like Statista, Kaggle, or government reports. Keep your content focused and well-organized. - Visualize your information
Organize your data into a clear structure or hierarchy. Choose visuals such as charts, icons, lists, or step-by-step formats to present content logically and attractively. - Choose your infographic template
Mediamodifier offers a variety of templates—timeline, process, comparison, photo-infographic, or informational layouts. Select one that best matches your content structure. - Customize your design
Use the editor to add fonts, colors, icons, images, and text that reflect your brand identity. Incorporate credits or sources in a discreet but visible manner on the design. Once finished, download or publish directly to your platforms.
We hope you have fun creating infographics the same way we had fun creating the infographic design templates and sharing our tips with you. Don’t forget to let us know if you create one by tagging @mediamodifier on social media.
Frequently Asked Questions about creating infographic online
What makes Mediamodifier ideal for crafting infographics?
Mediamodifier features a drag-and-drop, browser-based editor offering a selection of professionally designed templates. This makes it highly accessible, even for users without prior design experience.
Do I need design skills to use it effectively?
Not at all. The platform is built for users of all skill levels. You can easily edit templates, change fonts and icons, and personalize designs without any advanced design background.
Where can I publish or embed my finished infographic?
You can download your completed design and share it within blog posts, presentations, social media platforms, reports, or any other digital format.
How should I credit sources in my infographic?
Include a small “Sources” or “Credits” section in discreet yet readable text—typically placed at the bottom of the infographic.
Can I reuse or edit a saved infographic later?
Yes. Mediamodifier allows you to save your designs and revisit them for future edits or updates, making it easy to refresh content without starting from scratch.
Can I reflect my brand identity in the design?
Absolutely. You can customize virtually all aspects of the template—fonts, colors, imagery—to align with your brand’s visual identity.
Related articles
Visualize your design Use a product mockup to showcase your design

Create your design Use our templates to create delightful designs for any medium